
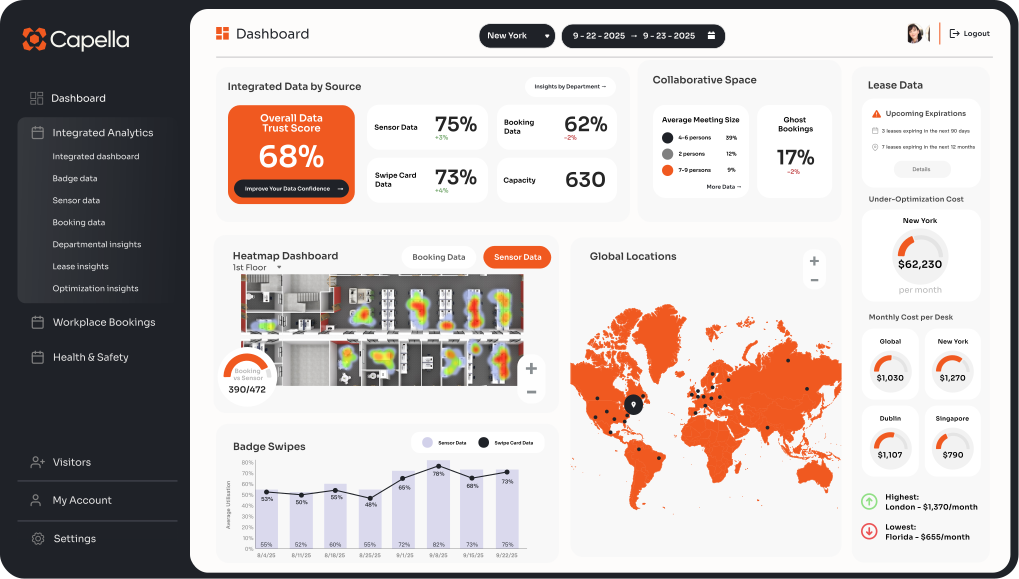
Real-time, integrated insights across every office, floor, team, and neighborhood.

All your workplace data, finally working together.
No more juggling spreadsheets, dashboards, and gut instinct. Capella brings all your occupancy data together in one place – and shows you how confident you can be in each data source. Most teams question their data – and for good reason. We help you cut through the noise, identify what’s reliable, and improve data quality over time so your team can make decisions and present reports with confidence.
Book a Demo
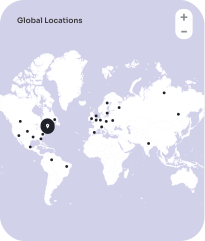
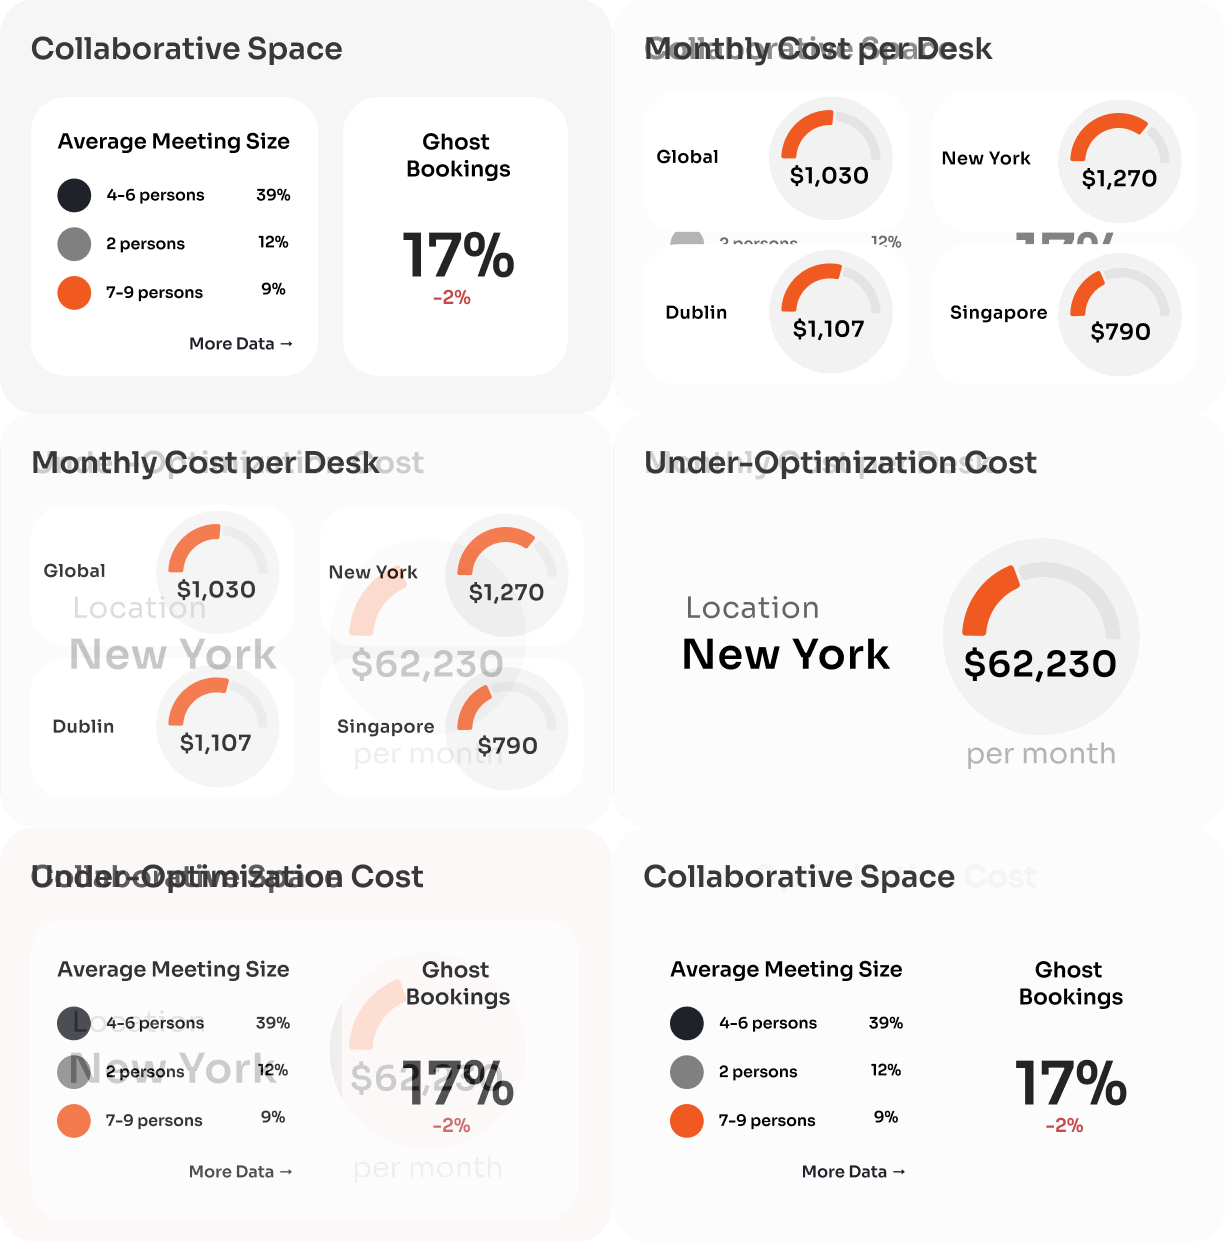
Real-time, integrated insights across every office, floor, team, and neighborhood.
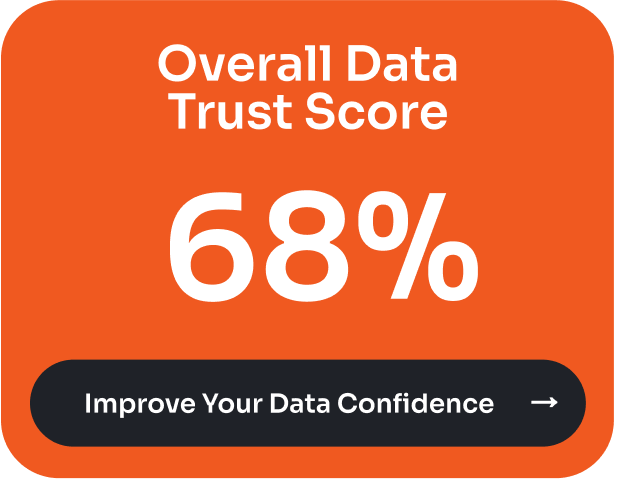
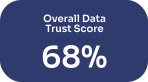
See how much you can trust each data source with a built-in confidence score. By comparing sources, accounting for known gaps, and flagging data that may not tell the full story, we help you see what’s solid, what’s uncertain, and how to keep improving over time.
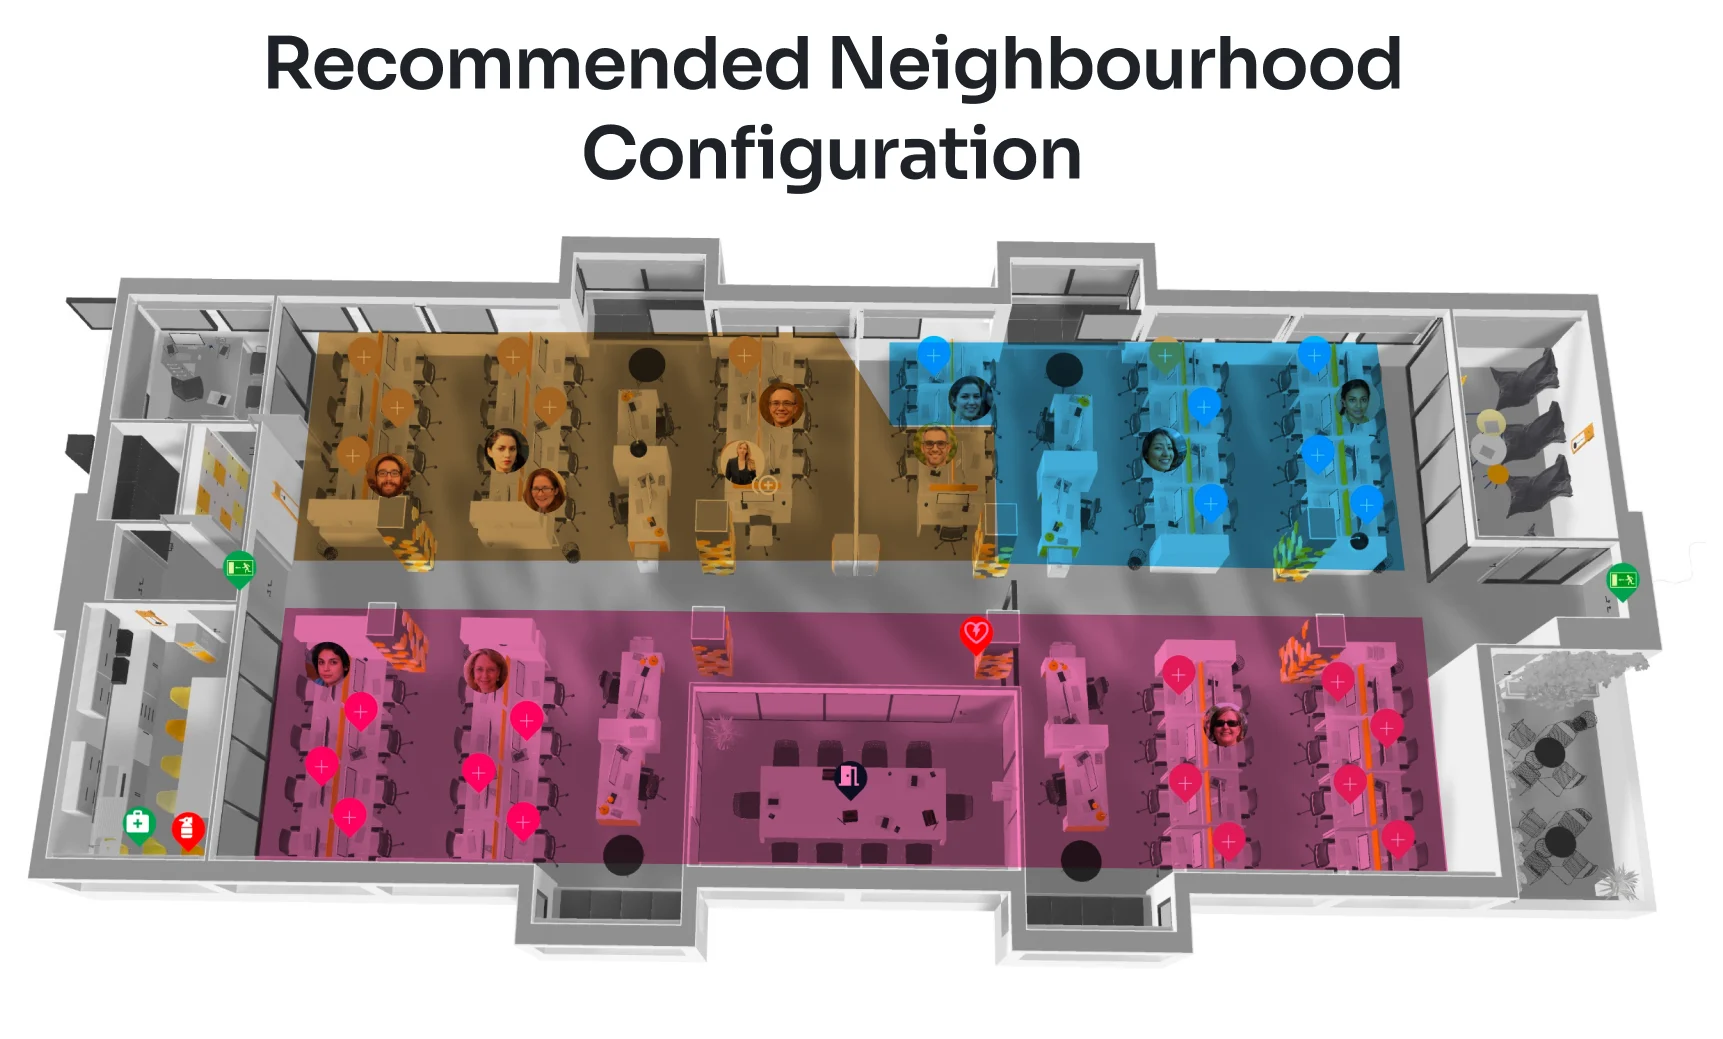
From neighborhood planning to relocations, get data-backed next steps in an instant.
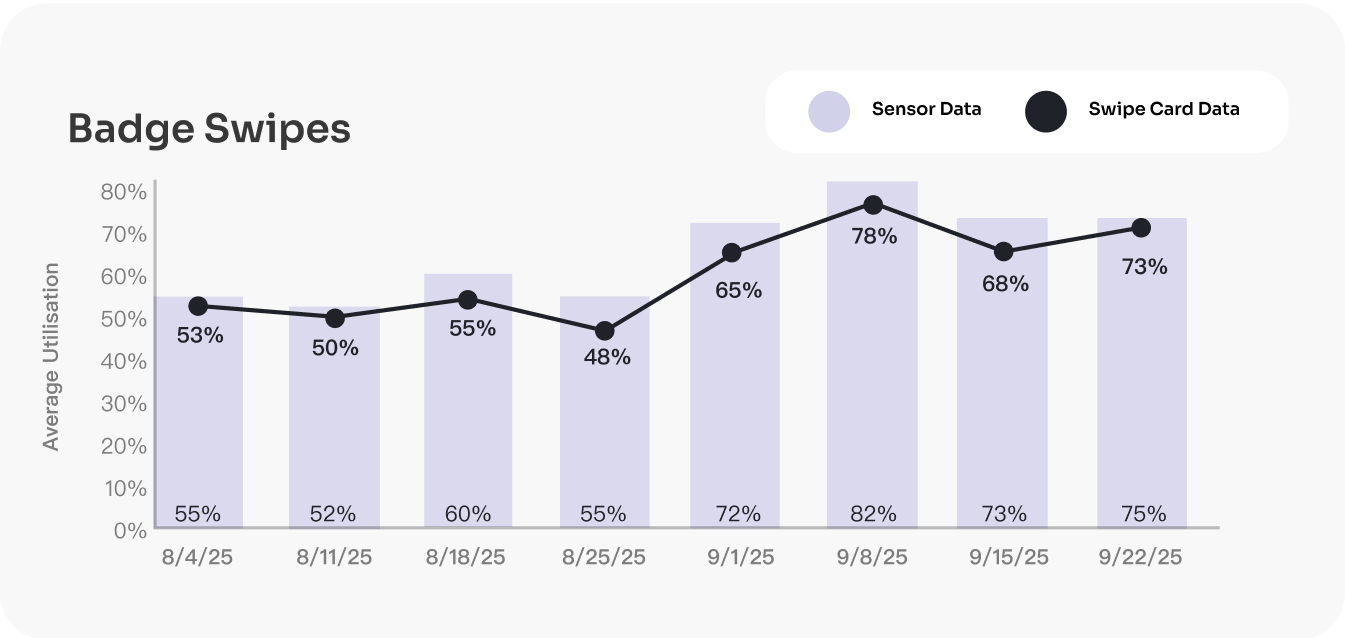
Look back across time, teams, and locations to understand long-term patterns and spot shifts in how space is used.
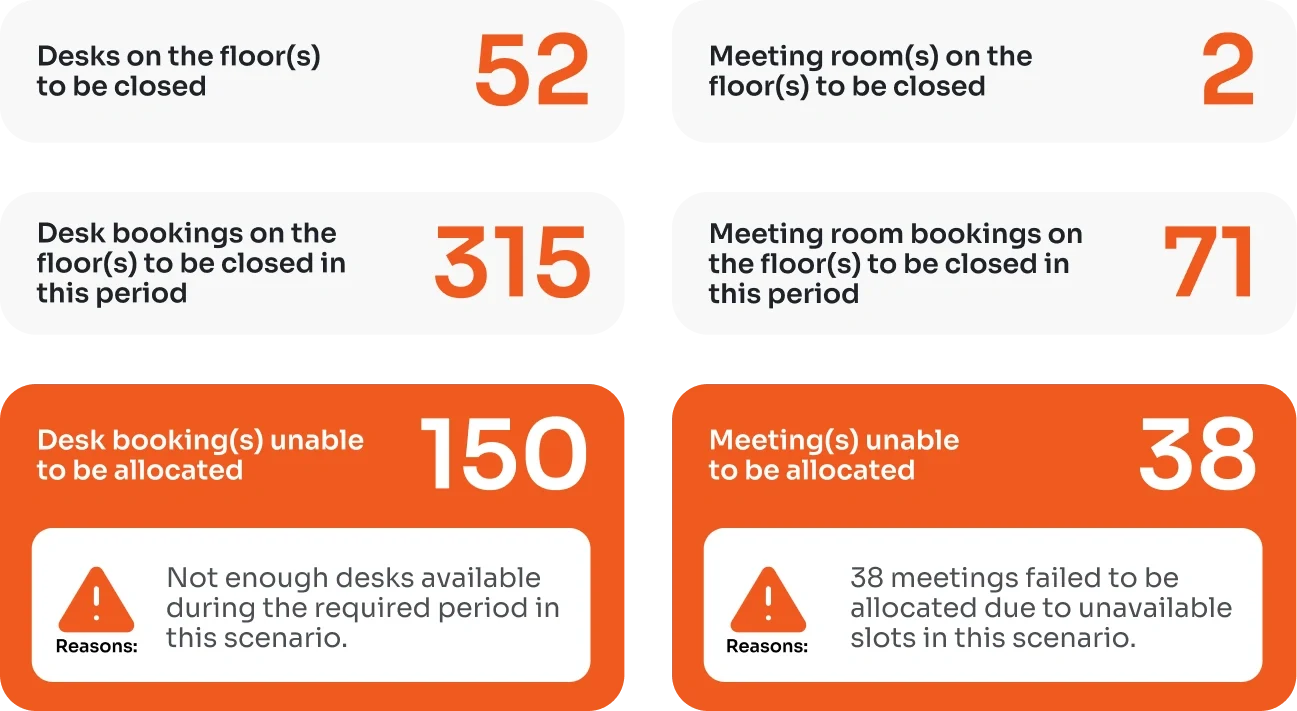
Forecast demand, simulate changes, and plan for growth, consolidation, or reconfiguration.
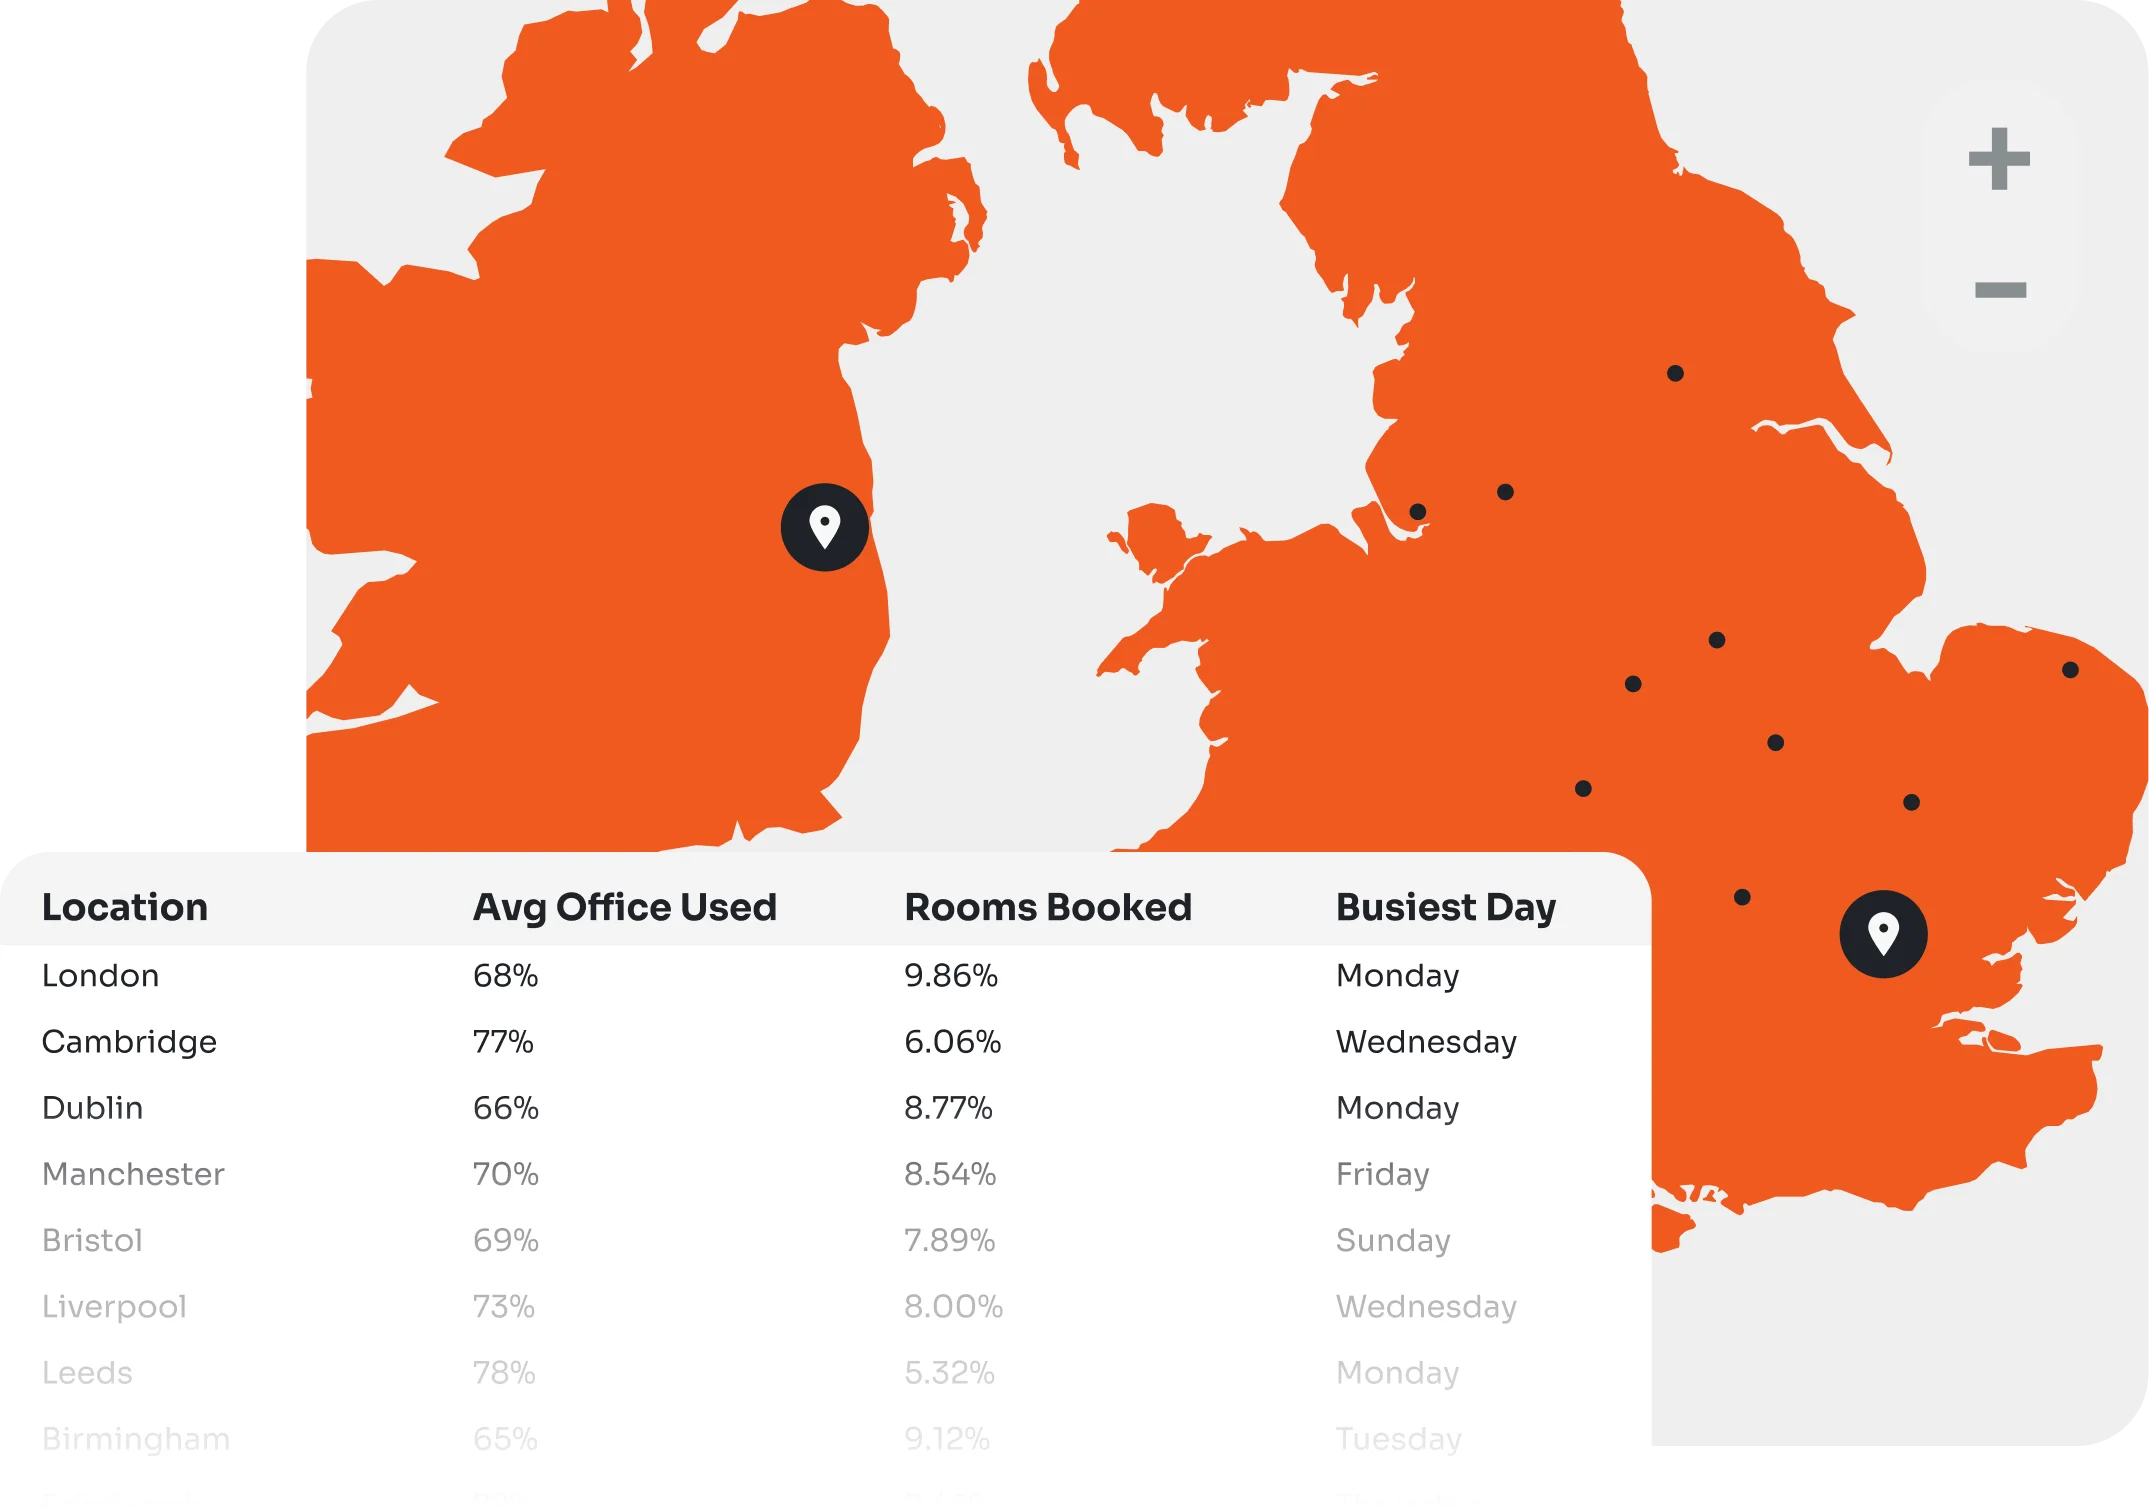
Whether it’s one office or 100, get the big picture and the small details.
Why it matters day to day
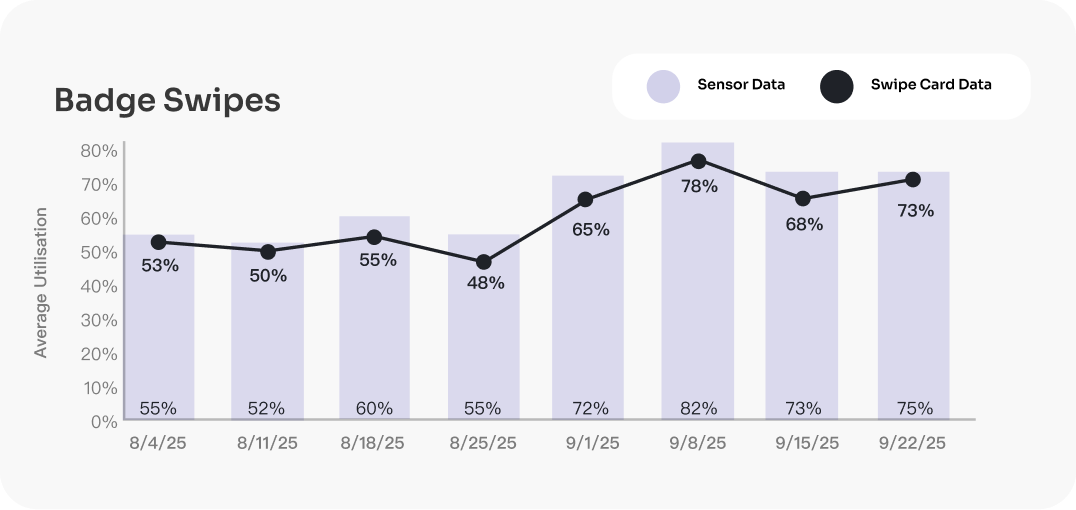
Save time by automatically comparing multiple siloed data sources
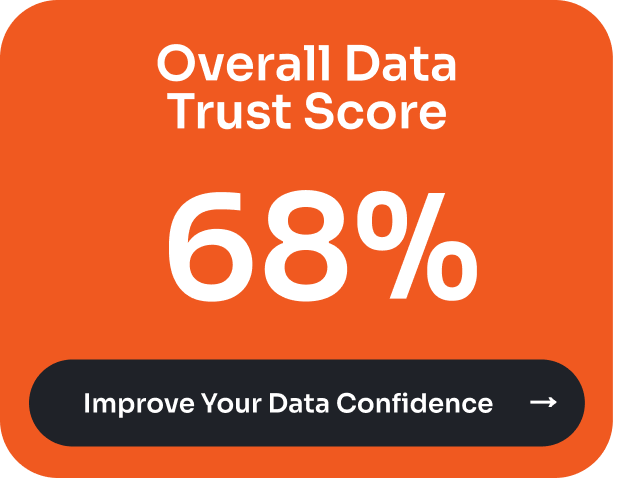
No one’s data is perfect – we show you how to take action with confidence.
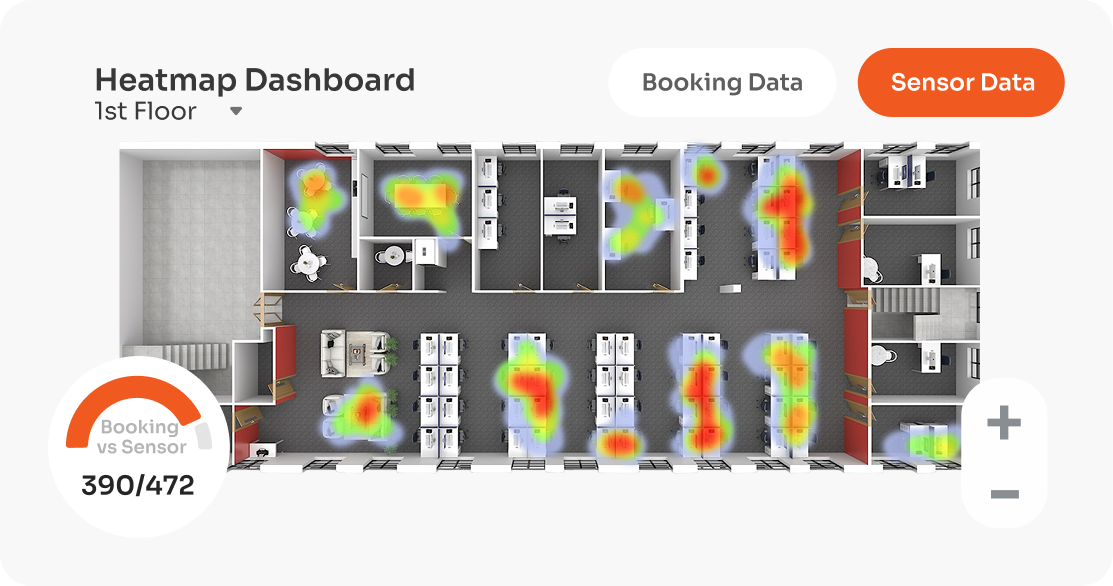
Align real estate and workplace decisions with how people actually work.
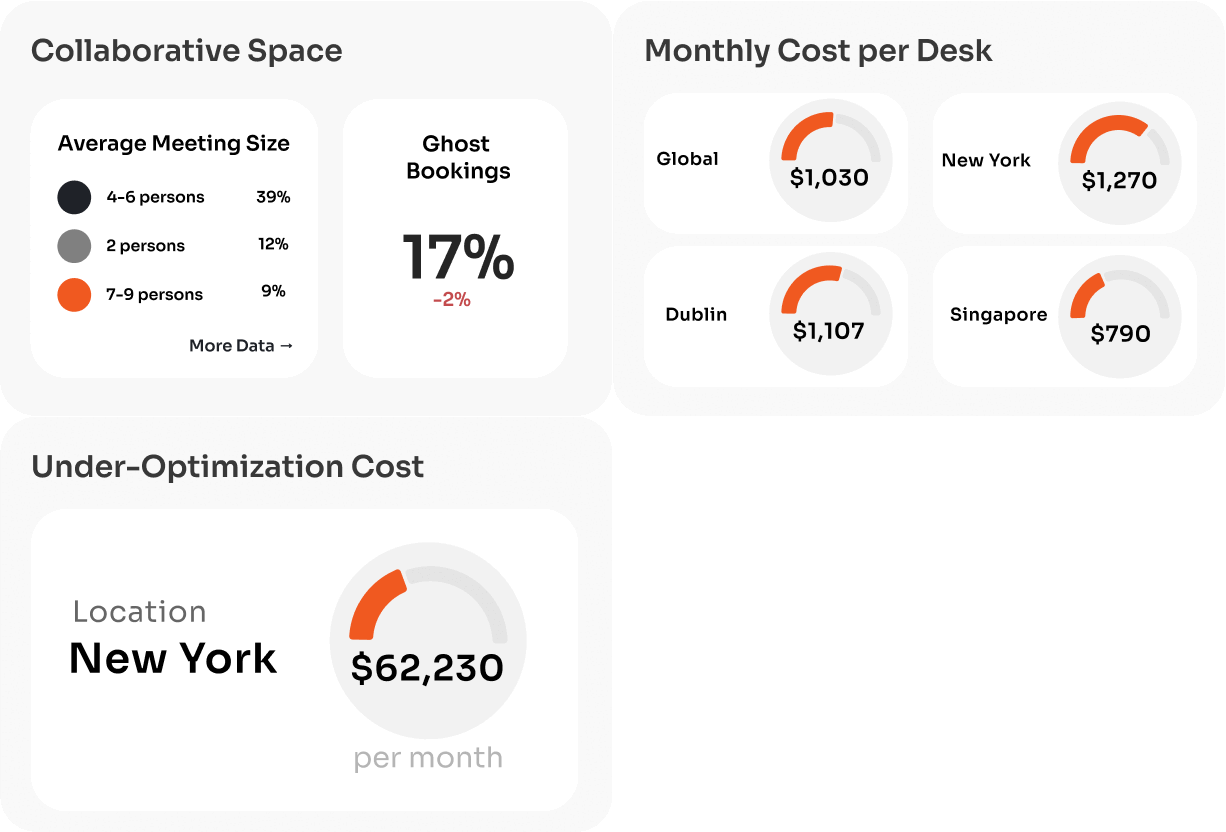
Find inefficiencies you didn’t know existed.
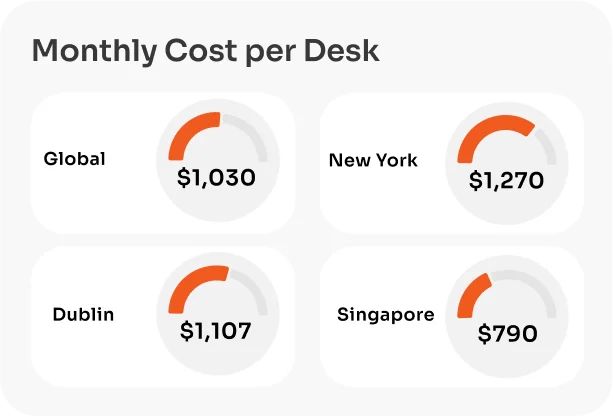
Save time by automatically comparing multiple siloed data sources
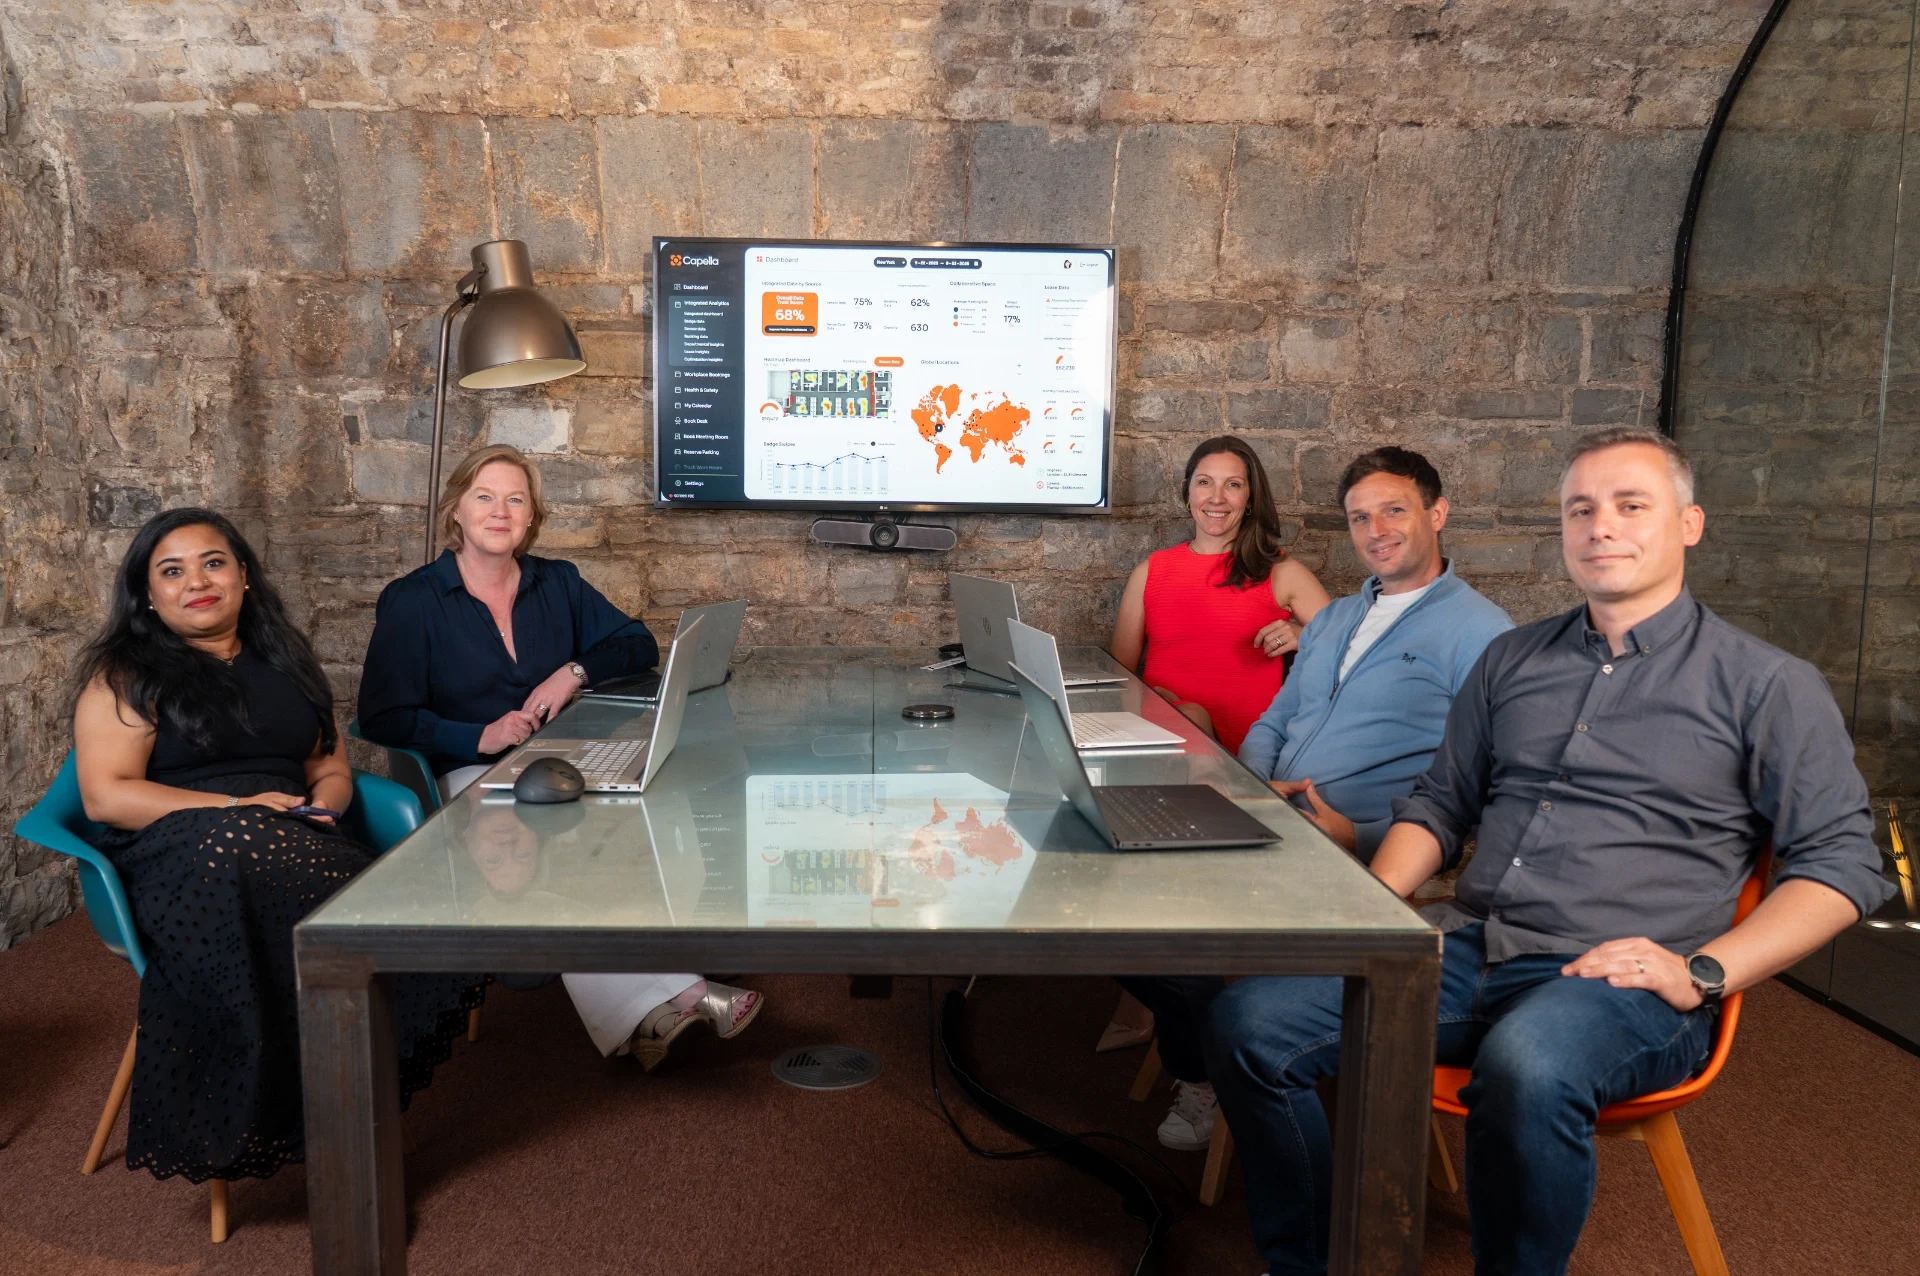
How Capella Delivers in the Real World
Capella is built to easily integrate with the systems you already use and love. Some examples of current integrations include access control systems, booking platforms, sensors, calendars, HR data, historical sources, even internal tools.
Our proprietary confidence score compares data across systems, accounts for known gaps or inconsistencies, and flags areas that may need closer attention. Capella’s confidence score helps you choose which data to rely on, highlighting what’s strong and flagging anything that might throw off your analysis.
That’s exactly why Capella exists. Most companies’ data is imperfect. We help you make the most of what you have and improve quality over time.
Yes. Capella combines historical and real-time data so you can model changes like neighborhood configuration, floor closures, or shifts in hybrid behavior. And with our confidence scoring, you can choose which data sets you want to use for scenario modeling.
We keep the setup light. Our platform is modular and built for flexibility so we can easily configure it to meet your integration and reporting needs.
In most cases, Capella is live within a few weeks. Teams love that we’re fast, flexible, and efficient with onboarding.
Our platform supports workplace teams, real estate leaders, IT, and operations – and anyone who makes decisions about space, people, and how work gets done.
Absolutely. We design for real workplace users. The experience is intuitive, visual, and built for action.